If you look at most of the available media coverage, it would appear that the central story, the so-called “Fiscal Cliff,” is the main driver of market sentiment and that a favorable outcome is the only thing that can prevent a total economic collapse. The reality is that a good deal of this coverage is misguided, alarmist, and overly focused on small, relatively insignificant developments that fail to explain the real economic effects that could be seen over the long term.
Here, we will look at some of the issue’s central components as well as some projections for two possible scenarios: either the Fiscal Cliff is reached (no compromise), or an alternative scenario is seen, where tax cuts are extended, Medicare payment rates are left unchanged, and the proposed automatic spending cuts are not implemented. This will allow us to sidestep the media hype and have a better understanding of how these factors will likely affect economic performance into the next decade.
The Fiscal Cliff Defined
In its most basic sense, the Fiscal Cliff is a metaphor for the economic negatives that would be created if the Republican-controlled US Congress and the Democrat-controlled US Senate are unable to reach a workable consensus on potential tax increases and reductions in government spending before the end of this year. The proposed changes come from a variety of sources, which include:
The 2011 Budget Control Act, designed to resolve the debt ceiling crisis seen last year (which calls for major cuts in defence spending)
The expiration period for the tax cuts enacted during the Bush Presidency (which were previously extended by President Obama)
The expiration period for payroll tax cuts in Social Security programs (a 2% reduction), and in federal unemployment benefits
So, if both sides are unable to reach an agreement and design workable countervailing actions before December 31st, all of these cuts will trigger automatically. An event like this would produce positives in that the 2013 budget deficit would see significant reductions. At the same time however, the economic disruptions created by these measures would weigh significantly on near term growth prospects and the collection of these negatives is what is referred to as the Fiscal Cliff.
Looking at the Worst Case Scenario
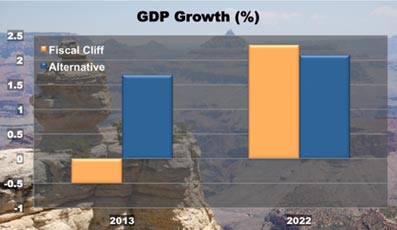
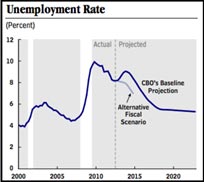
According to the Congressional Budget Office (CBO), a scenario where no action is taken would result in a 0.5% reduction in US GDP growth in 2013 (adjusted for inflation). On an individual level, a change like this will seem inconsequential but looking at the broader economy, this would create recessionary conditions that have wider implications. For example, CBO projections suggest that the US Unemployment Rate would rise from the 7.9% seen now to 9.1% by the end of next year. Since these are levels not seen since the middle of 2011, this would essentially mean that the US economy would lose more than 2 years of economic progress.
The question investors should be asking however is whether or not the metaphor is misleading. To be sure, the term Fiscal Cliff suggests we will see an immediate and irreversible decline in the economy on 1 January 2013 – but the reality is not quite that simple.
Assessing Two Potential Scenarios
Here, we will look at the CBO’s projected long term outcomes in a Fiscal Cliff scenario (no agreement is reached) and in an Alternative scenario, where each political body gets what it wants.
Looking at the chart below, we can see that “going off the cliff” will likely shrink US GDP by roughly 0.5% in 2013. At the same time, appeasing all sides will likely lead to growth of 1.5%for the year. When we look longer term (to 2022), the increased debt burden that is created by the Alternative scenario has relatively limited effects, reducing annual GDP on a comparative basis by less than half of 1%.

Next, we look at labor market projections. In the Fiscal Cliff scenario the Unemployment Rate is projected to reach above 9% in 2013, while in the alternative scenario, the expectations are closer to 8%. Longer term, the 2022 Unemployment Rate is expected to stabilize around 5% in both scenarios:

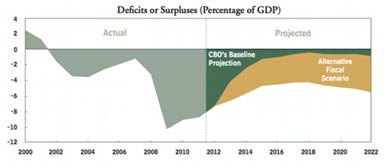
Next, we look at the US national deficit, which many would argue is the reason for the entire debate in the first place. Though it should be remembered that increased deficits contribute to total debt, the overall differences are not substantial. Under the Fiscal Cliff scenario, spending cuts and tax reductions will reduce the deficit to a projected 0.4% of GDP by 2018. In the alternative scenario, the deficit is only reduced to 4.2% of GDP.

So, while the data does show some temporary disruptions in the overall performance of the US economy, the worst case scenario is not all that different than the alternatives when we look at the economy over a longer term perspective. As always, it is important to look at the real data, rather than just the headlines, as this will lead to a better understanding of how markets are likely to perform over time.


